Saves time and reduces frustration for small business owners who need to create professional financial or operational dashboards without paying for specialized software.
What is the Google Sheets combo charts update and what changed?
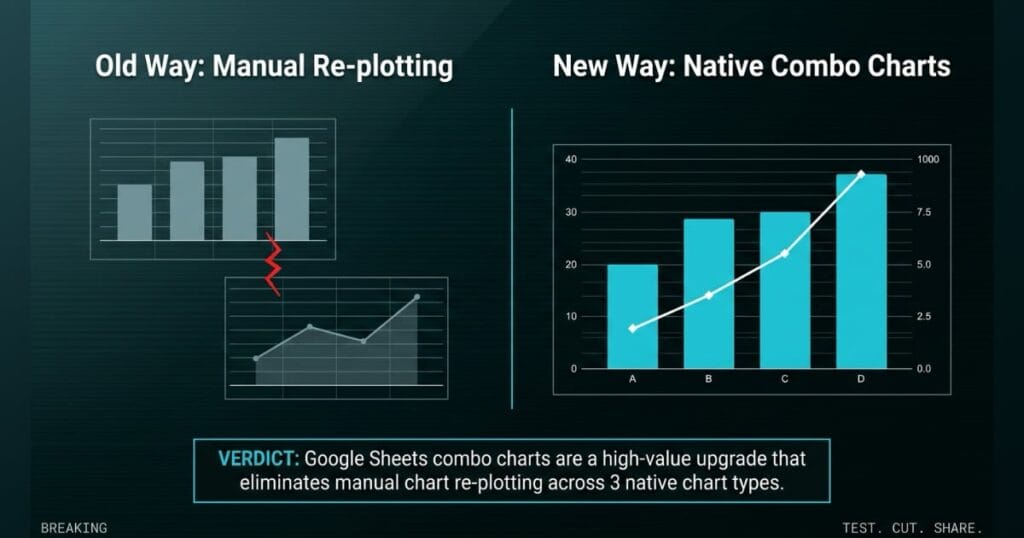
Google Sheets now offers native combo charts, allowing you to visualize multiple data series with different scales in a single visualization. This update removes the requirement to manually re-plot complex datasets.
You can now generate 3 specific chart formats natively, including clustered column line, clustered column line on a secondary axis, and custom combos. The custom combo option lets you assign different metrics to independent axes without leaving your spreadsheet environment.
The update rolls out to Rapid Release domains starting July 20, 2026, and to Scheduled Release domains starting August 4, 2026. Availability covers all Google Workspace customers and users with personal Google accounts.
Native combo chart support in Google Sheets eliminates manual re-plotting for complex datasets.
What is the evidence behind the Google Sheets combo charts update?
The official Google Workspace Updates blog confirms 3 native combo chart types: Clustered Column Line, Clustered Column Line on Secondary Axis, and Custom Combo. Each format handles different scales and metrics in a single visualization.
Google confirmed that importing external files with combo charts previously resulted in the secondary axis being dropped. The new compatibility update ensures that secondary axis configurations and combo chart types are preserved during Microsoft Excel file imports.
Rapid Release domains started receiving the feature on July 20, 2026, with Scheduled Release following on August 4, 2026, both completing visibility within 15 days. All Google Workspace customers and personal account users receive the update, with no admin control required.
The official Google update confirms 3 native combo chart types and preserved Microsoft Excel secondary axes during imports.
How does the Google Sheets combo charts update compare to the alternatives, and what background do small business owners need?
Google Sheets combo charts provide a native visualization solution within your existing spreadsheet environment. The primary advantage is that this functionality is built directly into Google Sheets, with no additional software required.
The enhanced Microsoft Excel import compatibility ensures you can transition files without losing your secondary axis configurations. Custom combos let you assign different metrics to independent axes without leaving your spreadsheet, which closes the gap between Sheets and desktop analytics tools.
The 3 native chart types cover the most common multi-series visualization needs, from revenue-versus-target overlays to cost-versus-volume comparisons. Founders who previously rebuilt charts after every Excel import no longer lose that work.
Google Sheets combo charts provide native multi-series visualization without additional software.
How does the Google Sheets combo charts update affect day-to-day operations for small businesses?
Day-to-day operations improve because you can build complex visualizations without requiring manual re-plotting. The update saves time when visualizing data with different scales and metrics.
Importing external files no longer drops your secondary axis configurations, which prevents manual re-plotting. You can review related operational workflow signals from the AI Profit Wire to see how native tools impact your bottom line.
You can now plot 2 different scales on a single chart natively, using clustered column line or custom combo formats. The 3 native chart types cover the most common multi-series visualization needs.
Native Google Sheets combo charts eliminate manual chart re-plotting for complex datasets.
A pallet of transmission fluid sits half-empty on the back rack at 5 AM, and the morning rush hasn’t even started. You pull up last week’s delivery log and this week’s outgoing orders, and the supplier volume needs to overlay your retail sell-through on a single chart.
You plot supplier volume on the primary axis and outgoing orders on the secondary axis to find the bottleneck. Previously, importing that spreadsheet from the supplier would drop the secondary axis entirely, leaving you with a flat line and hidden stockouts you’d only catch when a customer walked in.
Now Google Sheets preserves that secondary axis configuration during the import across all 3 native combo chart types. You spot the transmission fluid deficit before the morning rush begins, with the secondary axis intact on the clustered column-line chart.
What is the final verdict on the Google Sheets combo charts update?
Google Sheets combo charts deliver a direct visualization upgrade with 3 native chart types: clustered column line, clustered column line on secondary axis, and custom combo. The inclusion of native combo charts and preserved Microsoft Excel imports eliminates the need for manual re-plotting.
You can now visualize 2 different data scales on a single chart natively. The update covers all Google Workspace customers and personal account users, with rollout completing within 15 days.
The ability to maintain secondary axes during file imports prevents data visualization loss across all 3 chart formats.
Google Sheets combo charts are a high-value upgrade that eliminates manual chart re-plotting.
Source: workspaceupdates.googleblog.com
