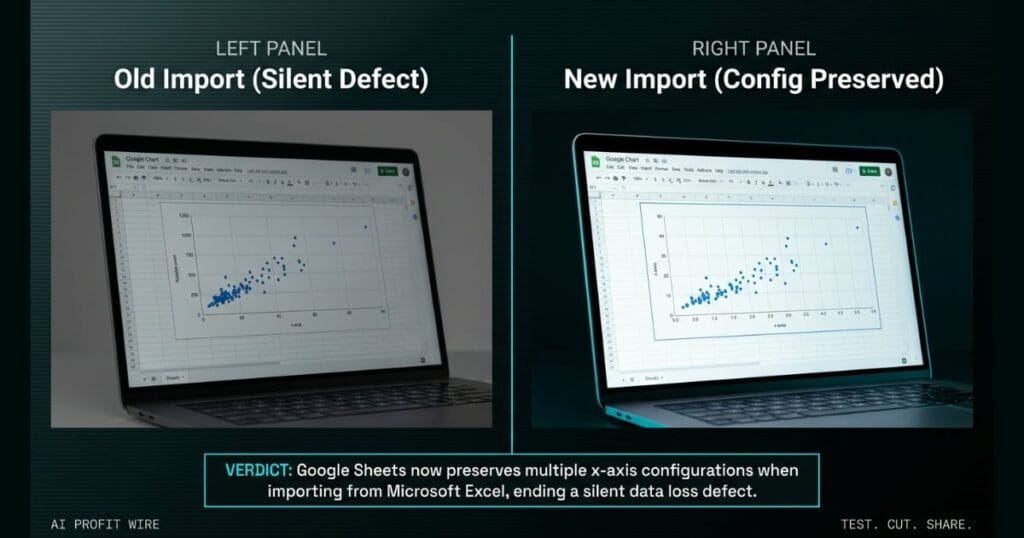
Saves time and reduces friction for businesses that rely on Excel and Google Sheets interoperability for financial and data reporting.
What is Google Sheets multiple x-axis scatter charts and what changed?
Google Sheets now allows users to create and edit scatter charts with multiple independent x-series. This update lets you map separate data series to unique x-axes instead of forcing a shared horizontal domain.
Previously, the platform forced all data series in a single chart to share the same horizontal axis domain. This limitation restricted complex data visualization.
Users can now assign independent x-axis values to individual data series within the same chart. This provides a much cleaner view of overlapping but distinct metrics.
Google Sheets eliminated a major data visualization constraint by supporting multiple independent x-axes.
What is the evidence behind Google Sheets multiple x-axis scatter charts?
The official Google Workspace Updates blog confirms the platform now accurately preserves multiple x-series configurations. This documentation verifies the feature is live for end users.
Previously, importing Excel files with multiple x-series scatter charts into Google Sheets would drop the extra axes. The system would automatically revert the data to 1 single x-axis.
The update confirms these configurations are now accurately preserved when moving spreadsheets between Microsoft Excel and Google Sheets. This prevents lost formatting and eliminates manual rebuilds.
Official documentation proves the import and export compatibility fixes the previous formatting loss.
How does Google Sheets multiple x-axis scatter charts compare to the alternatives, and what background do small business owners need?
Microsoft Excel has historically handled multiple x-axis scatter charts natively. Google Sheets previously lacked this specific charting function, creating friction for founders who rely on both platforms.
When businesses imported Excel files into Google Sheets, the extra axes were dropped entirely. This interoperability failure created friction for founders who rely on both platforms.
This update brings Google Sheets to parity with Microsoft Excel for this specific charting function. Founders can now move files between platforms without losing their multiple x-axis configurations.
The feature is available to all Google Workspace customers and users with personal Google accounts, which means there is no upgrade path required. The rapid release rollout started on July 29, 2026, with the scheduled release following on August 14, 2026.
Google Sheets now matches Microsoft Excel compatibility without forcing small business owners to buy extra software.
How does Google Sheets multiple x-axis scatter charts affect day-to-day operations for small businesses?
Small business owners no longer need to manually rebuild scatter charts after moving spreadsheets between platforms. This eliminates manual formatting fixes and reduces reporting friction.
Teams can now visualize distinct operational metrics in a single view without distorting the data. You can track other critical software updates to keep your daily operations lean.
The feature is available to all Google Workspace customers and users with personal Google accounts at no additional cost. The rapid release rollout started on July 29, 2026, with the scheduled release following on August 14, 2026.
End users do not need admin approval to enable the feature, because the Google Workspace Updates blog confirms there is no admin control for this functionality. Founders can start using multiple x-axis scatter charts immediately on rapid release domains.
Day-to-day operations accelerate because cross-platform spreadsheet formatting stays intact automatically.
A master detailer finishes a paint correction and hands the keys back to the client. The glossy finish looks flawless under the shop lights, and the customer drives away satisfied. The next morning, the client calls back furious because the direct sunlight revealed a hidden area where the compound was never fully buffed out.
The detailer did the work, reported complete success, and left a hidden defect that caused an operational failure later. Google Sheets used to do the exact same thing to your spreadsheets when you imported them from Excel. The file opened fine, but the system silently dropped your extra x-axes and reverted your complex charts to 1 single x-axis. You think your data is intact until you present the financial report, and the visual context is completely ruined.
The fix preserves your multiple x-axis configurations when moving spreadsheets between platforms. The 1 single x-axis revert is gone, which means the chart you built in Excel is the chart your team sees in Google Sheets.
What is the final verdict on Google Sheets multiple x-axis scatter charts?
This update removes a silent interoperability defect that previously destroyed complex spreadsheet formatting. Small business owners can now safely move files between Microsoft Excel and Google Sheets without losing their multiple x-axis configurations.
The feature is available to all Google Workspace customers and personal account users at no additional cost. The Hype Check on this one lands at 7 out of 10, because the fix targets a real defect that founders have been working around for years.
It is a necessary fix for any founder who relies on cross-platform data reporting. The silent data loss is gone, and the manual chart rebuilds are gone with it.
Google Sheets multiple x-axis scatter charts deliver a high-value formatting fix that saves small business owners measurable time.
Source: workspaceupdates.googleblog.com
